

Hey everyone! So, I’ve been looking into how insurance claims change throughout the year, and it’s pretty interesting. You know how some things just happen more at certain times? Like, more car accidents in winter or more storm damage in the summer? Well, insurance companies deal with that too. They call it seasonal claims trend modeling, and it’s basically about figuring out these patterns so they can be ready. It helps them plan, manage resources, and make sure they can handle everything when it comes in. Let’s break down what goes into this and why it matters.
Key Takeaways
- Understanding seasonal claims trend modeling means looking at how claim numbers go up and down during the year. This helps predict future claims.
- To do this modeling, you need clean data, methods to break down trends, and ways to include outside factors like weather or economic changes.
- New tech like machine learning and AI can make predictions better, but you still need to check if the models are actually working well.
- Things like climate change, economic shifts, and new rules can really mess with normal claim patterns, so models need to account for them.
- Putting these models into action helps companies manage their resources better, improve how they handle claims, and make smarter business decisions overall.
Understanding Seasonal Claims Trend Modeling
When we talk about insurance claims, it’s easy to think of them as random events. But if you look closely, especially over time, you start to see patterns. These aren’t just random spikes; many claims follow predictable cycles. Think about it: more car accidents happen in winter when roads are icy, or maybe there’s a surge in home insurance claims after a major holiday season due to cooking mishaps or decorations causing issues. Understanding these seasonal patterns is key to managing an insurance business effectively. It helps us move beyond just reacting to claims and start anticipating them.
The core idea behind seasonal claims trend modeling is to identify and quantify these recurring fluctuations in claims data that are tied to specific times of the year. By doing this, we can get a clearer picture of what’s really going on with our claims, separate from long-term growth or random noise. This isn’t just an academic exercise; it has real-world implications for how insurers operate.
The Role of Data in Seasonal Claims Analysis
Data is the bedrock of understanding any trend, and seasonal claims analysis is no different. Without good data, we’re just guessing. We need historical records of claims – when they happened, what type they were, and how much they cost. The more detailed and accurate this data is, the better we can spot those seasonal shifts. It’s like trying to understand the weather without any temperature readings; you wouldn’t get very far.
Here’s a look at what makes claims data so important for this kind of analysis:
- Volume: Tracking the number of claims filed over time. This gives us the raw numbers to see peaks and valleys.
- Severity: Understanding the cost associated with claims. A seasonal increase in minor claims might be manageable, but a seasonal rise in very expensive claims needs a different approach.
- Type: Categorizing claims (e.g., auto, property, liability) helps identify if seasonality affects all areas equally or if certain lines of business are more prone to predictable fluctuations.
- Geography: Claims patterns can vary significantly by region. A seasonal trend in Florida might be related to hurricane season, while a trend in the Midwest could be tied to winter storms.
Identifying Cyclical Patterns in Claims Data
Spotting these cycles isn’t always straightforward. Sometimes the patterns are obvious, like a big jump in claims right after a major holiday. Other times, they’re more subtle, perhaps a gradual increase in certain types of claims throughout the spring or fall. We need methods to pull these patterns out from the day-to-day noise. This involves looking at data over multiple years to confirm that a pattern is indeed seasonal and not just a one-off event. For instance, if we see a spike in water damage claims in January for three years running, that’s a strong indicator of a seasonal trend. This kind of insight is critical for effective loss modeling and exposure analysis.
Forecasting Future Claims with Seasonal Models
Once we’ve identified and understood these seasonal patterns, the next logical step is to use that knowledge to predict what’s coming. Seasonal models allow us to forecast claims not just based on overall growth, but also factoring in the predictable ups and downs throughout the year. This means an insurer can better prepare for periods of high claim volume, ensuring they have adequate staffing and resources. It also helps in financial planning, allowing for more accurate budgeting and reserving. By incorporating seasonality, our forecasts become more precise, moving us closer to a proactive rather than reactive stance in claims management. This predictive capability is a cornerstone of modern insurance operations, helping to manage financial risk more effectively.
Key Components of Seasonal Claims Modeling
To really get a handle on seasonal claims trends, you need to break down the process into a few core parts. It’s not just about looking at the numbers; it’s about preparing them, understanding what they’re telling you, and then building models that can actually predict what’s coming next. This involves a mix of cleaning up your data, using the right statistical tools, and sometimes, bringing in outside information.
Data Preprocessing for Trend Analysis
Before you can even think about modeling, your data needs to be in good shape. Think of it like prepping ingredients before you cook – you can’t make a good meal with rotten vegetables. This means dealing with missing values, correcting errors, and making sure all your data is in a consistent format. You’ll also want to look at things like outliers, which can really skew your results if you’re not careful. Standardizing formats and cleaning up inconsistencies is a big part of this step.
- Handling Missing Data: Decide whether to impute, remove, or flag missing data points. The best approach depends on how much data is missing and why.
- Outlier Detection and Treatment: Identify extreme values that might be errors or genuine but unusual events. Decide whether to cap, transform, or remove them.
- Data Transformation: Apply transformations like log or square root to normalize data distribution if needed, which can help statistical models perform better.
- Feature Engineering: Create new variables from existing ones that might better capture seasonal effects or other relevant patterns.
The goal here is to create a clean, reliable dataset that accurately reflects the historical claims experience, free from noise that could mislead your analysis.
Statistical Methods for Seasonal Decomposition
Once your data is prepped, you can start pulling out the different patterns. Seasonal decomposition is a way to break down a time series into its main parts: the overall trend, the seasonal ups and downs, and whatever’s left over (the irregular component). This helps you see the underlying patterns more clearly.
- Additive Decomposition: Assumes the seasonal component is added to the trend and irregular components. This is often suitable when the seasonal variation is roughly constant over time.
- Multiplicative Decomposition: Assumes the seasonal component is multiplied by the trend and irregular components. This is useful when the seasonal variation increases or decreases with the trend.
- STL Decomposition (Seasonal and Trend decomposition using Loess): A more robust method that can handle various types of seasonality and is less sensitive to outliers than simpler methods.
Incorporating External Factors into Models
Claims aren’t just driven by the calendar. Things like economic shifts, weather events, or even changes in regulations can have a big impact. To make your seasonal models more accurate, you need to find ways to include these external influences. This might involve adding new data series to your model that represent these factors. For example, if you see a spike in auto claims during certain months, you might want to see if that correlates with changes in driving patterns or even local weather. Understanding these coverage triggers and temporal structure can be key here.
- Economic Indicators: Include data like unemployment rates, consumer spending, or inflation, which can affect claim frequency and severity.
- Weather Data: For property claims, incorporating historical weather data (temperature, precipitation, storm activity) is vital.
- Demographic Shifts: Changes in population age, density, or distribution can influence certain types of claims.
- Regulatory Changes: New laws or compliance requirements can alter claim reporting or handling, impacting trends.
Advanced Techniques in Seasonal Claims Forecasting
Machine Learning for Enhanced Prediction
When we talk about forecasting claims, just looking at past numbers in a simple way might not cut it anymore. That’s where machine learning (ML) comes in. ML models can sift through way more data than we can manually, finding patterns that aren’t obvious. Think about it: instead of just seeing that claims go up in winter, ML can connect that to weather forecasts, social media buzz about winter sports, or even changes in traffic patterns. It’s about building models that learn and adapt.
These models can handle complex relationships. For example, a model might learn that a heatwave in one region not only increases claims for heatstroke but also, indirectly, leads to more claims for spoiled food due to power outages. This kind of interconnectedness is hard to spot with traditional methods. We’re moving beyond just predicting when claims might rise to predicting why and how much with more accuracy.
Here’s a quick look at how ML helps:
- Feature Engineering: Creating new data points from existing ones (like combining temperature and humidity to predict heat-related illnesses).
- Model Training: Using algorithms like Random Forests, Gradient Boosting, or Neural Networks to learn from historical data.
- Prediction: Generating forecasts for future claim volumes and types.
The goal is to get a more nuanced view of future claims, not just a broad seasonal trend.
Machine learning allows us to move from reactive forecasting to proactive risk assessment by uncovering subtle correlations within vast datasets. This means insurers can better prepare for the specific types and volumes of claims likely to arise.
Time Series Analysis for Claims Trends
Time series analysis is a core part of understanding how claims change over time. It’s not just about looking at the numbers month by month; it’s about breaking down the data into its different components. We can separate the overall upward or downward movement (the trend) from the regular ups and downs that happen every year (seasonality), and even the random noise that’s hard to explain.
Methods like ARIMA (AutoRegressive Integrated Moving Average) and its variations are really useful here. They help us model the dependencies between past observations and future ones. For instance, if we see a spike in property claims after a major storm, ARIMA can help us understand how long that effect might linger and how it influences the baseline trend. It’s about building a statistical picture of the data’s behavior.
Here’s a breakdown of what we look for:
- Trend: The long-term direction of claims (e.g., increasing due to population growth).
- Seasonality: Predictable patterns that repeat over a fixed period (e.g., higher auto claims in winter).
- Cyclicality: Longer-term fluctuations not tied to a fixed period (e.g., related to economic cycles).
- Irregularity: Random, unpredictable variations.
By decomposing the time series, we get a clearer view of each component, which makes forecasting more reliable. This is especially important when trying to understand the impact of specific events on underwriting renewable energy systems or other specialized insurance lines.
Validating Seasonal Model Performance
So, you’ve built a fancy seasonal claims model. Great! But how do you know if it’s actually any good? That’s where validation comes in. It’s like double-checking your work to make sure your predictions are on the right track. We don’t just want to trust the model blindly; we need proof it works.
One common way is to split your historical data. You use one part to train the model and the other part to test it. This way, you see how well the model predicts data it hasn’t seen before. If it performs well on the test data, that’s a good sign. We also look at metrics like Mean Absolute Error (MAE) or Root Mean Squared Error (RMSE) to quantify how far off the predictions are from the actual results.
Here are some key validation steps:
- Hold-out Sample Testing: Using a portion of data the model wasn’t trained on.
- Cross-Validation: A more robust technique where data is split multiple times to test the model on different subsets.
- Backtesting: Simulating how the model would have performed historically against actual past events.
We also need to consider if the model is still relevant over time. Markets change, new risks emerge, and consumer behavior shifts. A model that was great last year might not be as effective today. So, continuous monitoring and re-validation are super important. It’s about making sure your forecasting tools stay sharp and relevant, especially when dealing with complex financial planning outcomes related to policy design.
Impact of External Factors on Claims Trends
When we talk about claims trends, it’s easy to get caught up in the numbers and the patterns we see in the data itself. But the reality is, insurance claims don’t happen in a vacuum. A whole host of outside forces can significantly shape how often claims occur and how severe they are. Understanding these external influences is key to building accurate seasonal models.
Climate Change and Catastrophic Events
Let’s face it, the weather seems to be getting more extreme. We’re seeing more frequent and intense natural disasters like hurricanes, wildfires, and severe storms. This directly impacts claims, especially for property and casualty insurance. A single major event can cause a massive spike in claims, skewing seasonal averages if not properly accounted for. Insurers have to think about how these climate-related exposures are changing.
- Increased frequency of severe weather events: More hurricanes, floods, and droughts mean more property damage claims.
- Severity of events: When these events do happen, they’re often more destructive, leading to higher claim costs.
- Geographic shifts: Climate change can alter risk zones, meaning areas previously considered low-risk might now face significant threats.
The growing unpredictability of natural disasters puts a strain on traditional risk models. Insurers need to adapt their underwriting and pricing to reflect these evolving environmental conditions.
Economic Conditions and Consumer Behavior
Economic ups and downs play a big role too. During economic downturns, people might delay maintenance on their homes or vehicles, potentially leading to more claims down the line. Conversely, a booming economy might mean more new construction or more people driving, which also affects claim volumes. Consumer behavior is also a factor; for example, changes in travel patterns can influence claims related to travel insurance or auto accidents. The way people interact with services, like using ride-sharing, also creates new risk profiles.
Regulatory Changes and Their Influence
Government regulations can also shift the landscape. New laws or changes in existing ones can affect what’s covered, how claims are handled, or even introduce new types of risks that need insurance. For instance, stricter environmental regulations might lead to more claims related to pollution cleanup. Similarly, changes in consumer protection laws can impact how insurers must interact with policyholders during the claims process. Staying on top of these evolving regulatory frameworks is vital for accurate forecasting.
- Changes in building codes affecting repair costs.
- New data privacy laws impacting how customer information is used.
- Updates to traffic laws influencing accident claims.
These external factors aren’t just background noise; they are active drivers of claims trends. Incorporating an understanding of these influences into seasonal modeling allows for more robust and realistic predictions.
Leveraging Technology for Claims Trend Insights

Digital Transformation in Claims Management
Technology is really changing how insurance companies handle claims. Think about it – instead of just paper forms and phone calls, we’ve got online portals, mobile apps, and even virtual inspections now. This digital shift means things can move faster and be more organized. It’s not just about speed, though; it’s about making the whole process smoother for everyone involved. Companies are investing in systems that can sort through claims automatically, flagging the ones that need a closer look. This helps speed up payouts for legitimate claims while also keeping an eye out for anything suspicious. It’s a big change from how things used to be done, and it’s still evolving.
The Power of Predictive Analytics
Predictive analytics is a game-changer for understanding claims trends. By looking at historical data, these tools can spot patterns that might not be obvious to the human eye. This helps insurers get a better idea of what kinds of claims might come in, and when. For example, knowing that certain types of weather events lead to a spike in property claims can help companies prepare. It’s like having a crystal ball, but based on solid data. This kind of forecasting helps with everything from staffing claims departments to managing financial reserves. Being able to anticipate trends means better planning and, ultimately, better service for policyholders. It’s all about using data to make smarter decisions about future risk.
Artificial Intelligence in Risk Assessment
Artificial intelligence (AI) is taking risk assessment to a whole new level. AI can analyze vast amounts of data, much more than any person could, to identify subtle patterns and potential risks. This is super helpful in spotting potential fraud early on. For instance, AI can flag claims that have similar characteristics or come from networks of individuals that might be trying to game the system. It’s not about replacing human judgment entirely, but about giving adjusters and investigators powerful tools to focus their attention where it’s most needed. This helps protect the integrity of the insurance pool and prevents unnecessary costs that could affect everyone’s premiums. It’s a sophisticated way to improve the accuracy of fraud detection.
Here’s a quick look at how technology is impacting claims:
- Automation: Streamlining routine tasks like data entry and initial claim assessment.
- Data Analysis: Identifying trends, patterns, and anomalies in claims data.
- Communication: Providing policyholders with real-time updates and self-service options.
- Fraud Detection: Using advanced algorithms to flag suspicious activities.
The integration of technology into claims management is not just about efficiency; it’s about building a more responsive, accurate, and secure system for both insurers and policyholders. It allows for a more proactive approach to risk and a more streamlined experience during what can often be a stressful time.
Operationalizing Seasonal Claims Insights
So, you’ve done the hard work. You’ve modeled your seasonal claims trends, identified patterns, and maybe even forecast what’s coming. That’s great, but what do you do with all that information? It’s not much use sitting in a report, right? The real value comes when you put these insights to work in your day-to-day operations. This is where the rubber meets the road, turning data into action.
Integrating Models into Underwriting
Seasonal trends have a direct impact on how you underwrite policies. For instance, if you know that certain regions see a spike in property claims during hurricane season, your underwriting guidelines should reflect that. This might mean adjusting pricing, requiring specific mitigation measures, or even modifying coverage terms for policies written during those peak periods. It’s about making sure your pricing accurately reflects the expected risk, not just historical averages. This proactive approach helps maintain profitability and ensures you’re not taking on undue exposure.
- Pricing Adjustments: Modify premiums based on seasonal risk profiles.
- Coverage Modifications: Introduce or adjust endorsements for seasonal perils.
- Risk Assessment: Incorporate seasonal data into underwriting scorecards.
- Geographic Focus: Pay closer attention to regional seasonal patterns.
The goal here is to align your underwriting practices with the predictable ebb and flow of risk. It’s not about avoiding risk entirely, but about managing it intelligently based on the best available data.
Optimizing Claims Handling Processes
Claims departments can really benefit from understanding seasonal fluctuations. Knowing when claims volume is likely to increase allows for better resource planning. You can staff up in anticipation of busy periods, train adjusters on specific types of seasonal claims, and ensure your claims management systems are ready for the surge. This helps reduce claim cycle times and improve customer satisfaction, especially during peak seasons. Think about having more adjusters ready to go when a major storm hits, or having specialized teams prepared for a winter freeze event. It makes a huge difference in how smoothly things run.
Here’s a look at how you might prepare:
- Staffing Projections: Forecast staffing needs based on anticipated claim volumes.
- Training Programs: Develop targeted training for seasonal claim types.
- Technology Readiness: Ensure claims processing systems can handle increased load.
- Vendor Management: Secure external adjusting resources in advance if needed.
This proactive stance is key to effective claims management.
Strategic Resource Allocation Based on Trends
Beyond just claims handling, seasonal modeling informs broader strategic decisions. Where should you focus your marketing efforts? When is the best time to launch new products or campaigns? Understanding seasonal demand for insurance products can help optimize marketing spend and product development timelines. For example, promoting flood insurance heavily before rainy seasons or offering discounts on travel insurance during peak vacation planning periods can be very effective. It’s about being in the right place, at the right time, with the right message.
- Marketing Campaigns: Align promotional activities with seasonal demand peaks.
- Product Development: Time new product launches to coincide with emerging needs.
- Capital Management: Anticipate capital needs based on projected claim payouts.
- Reinsurance Planning: Inform reinsurance treaty renewals with seasonal loss expectations.
By integrating seasonal insights into these operational areas, you move from simply reacting to claims to proactively managing risk and optimizing business performance throughout the year. It’s about making your insurance operations smarter and more responsive.
Challenges in Seasonal Claims Modeling
While seasonal modeling offers a powerful lens for understanding claims trends, it’s not without its hurdles. Getting these models right requires careful attention to detail and a realistic view of what can go wrong.
Data Quality and Availability
One of the biggest headaches is the data itself. You need a solid history of claims, broken down in a way that lets you see seasonal shifts. If your data is messy, incomplete, or doesn’t go back far enough, your model will be built on shaky ground. Think about it: if you don’t have reliable records of past claims, how can you possibly predict future patterns accurately? This is especially true for newer lines of business or in regions where data collection has been inconsistent.
- Inconsistent data formats across different systems.
- Missing data points for specific periods or claim types.
- Lack of granular detail (e.g., specific cause of loss, precise date of incident).
Model Complexity and Interpretability
As you try to make your seasonal models more sophisticated, they can quickly become difficult to understand. A model that’s a black box, even if it’s accurate, is hard to trust and even harder to explain to stakeholders. You need to be able to justify why the model is predicting what it is, especially when it comes to pricing or resource allocation. Finding that sweet spot between predictive power and clear explanation is key. It’s a balancing act, for sure.
The drive for more complex models, often fueled by advanced analytics, can sometimes obscure the underlying drivers of claims. It’s important to remember that a model’s value isn’t just in its predictive accuracy, but also in its ability to inform business strategy through understandable insights.
Adapting to Unforeseen Events
Seasonal models are great for predictable cycles, but they often struggle with the unexpected. Think about major weather events that fall outside typical seasonal patterns, or sudden shifts in consumer behavior due to external factors. These outliers can throw off your model’s predictions significantly. While you can try to build in adjustments for known external factors, truly unpredictable events are the bane of any forecasting effort. This is where catastrophe modeling becomes important, as it specifically addresses extreme, low-frequency events that seasonal models might miss.
- Sudden spikes in claims due to widespread events (e.g., a pandemic, a major technological failure).
- Unusual weather patterns that deviate significantly from historical norms.
- Rapid changes in economic conditions impacting claim frequency or severity, like those seen in transportation liability.
These challenges mean that while seasonal modeling is a valuable tool, it needs to be used with a clear understanding of its limitations and supported by robust data governance and a willingness to adapt.
The Future of Seasonal Claims Trend Analysis
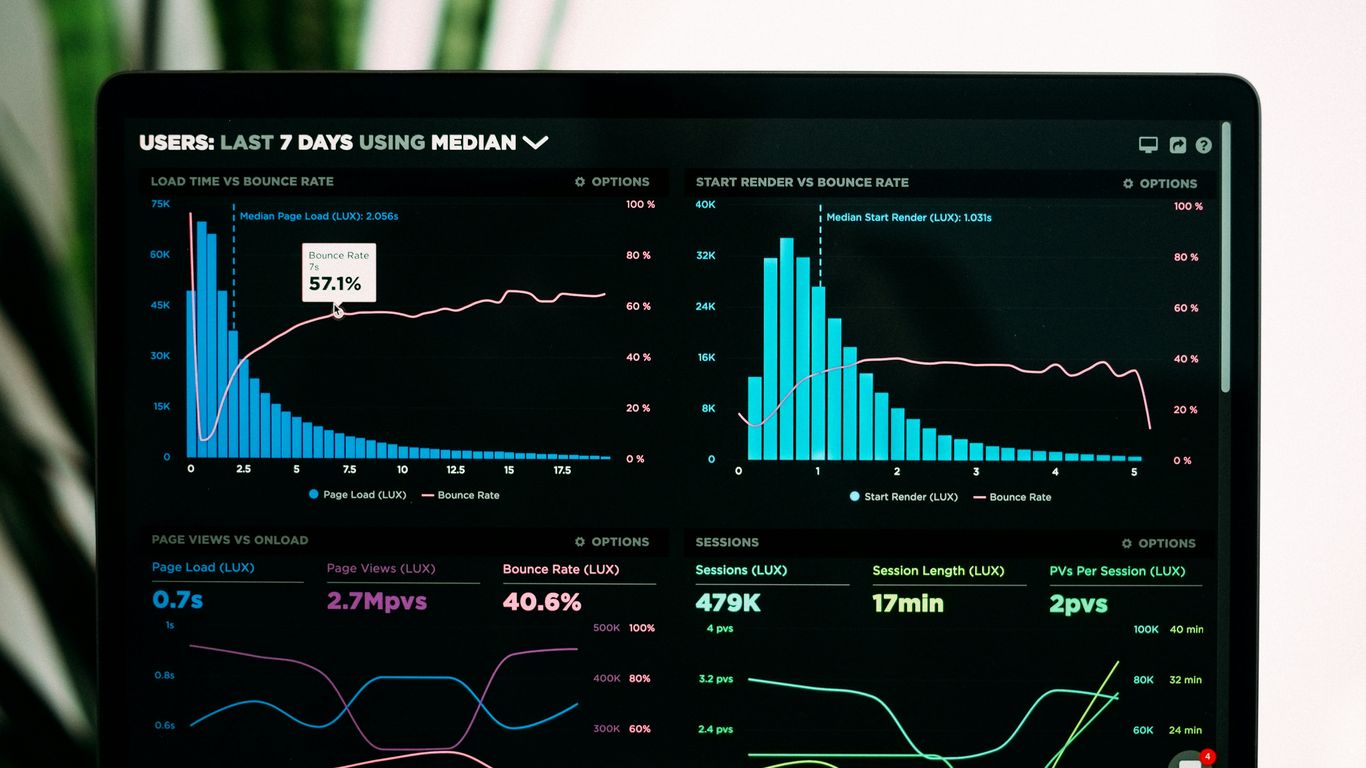
The landscape of seasonal claims trend analysis is constantly shifting, driven by new data sources and smarter ways to look at that data. We’re moving beyond just looking at past patterns to really anticipating what’s coming next. This means insurers can get ahead of the curve, not just react to it.
Evolving Data Sources and Methodologies
Think about all the new information available now. We’re not just talking about historical claims data anymore. We’re seeing data from IoT devices, social media sentiment, and even satellite imagery. These diverse sources, when combined with advanced analytical techniques, paint a much richer picture of potential risks. For instance, weather data from multiple sources can now be integrated with property data to better predict the impact of severe weather events on claims. This allows for more precise modeling than ever before.
- Real-time Weather Feeds: Integrating live meteorological data.
- Geospatial Information: Using satellite and aerial imagery for property risk assessment.
- Social Media Monitoring: Gauging public sentiment and potential event impact.
- IoT Sensor Data: Tracking conditions in homes or vehicles that might lead to claims.
Real-Time Claims Trend Monitoring
Waiting for monthly or quarterly reports just doesn’t cut it anymore. The goal is to have systems that can monitor claims trends as they happen. This means setting up alerts for unusual spikes in claim frequency or severity in specific regions or for particular types of events. Imagine getting an alert about a sudden increase in water damage claims in a coastal area right after a heavy rainstorm. This kind of immediate insight allows for rapid adjustments to staffing, reserves, and even fraud detection efforts. It’s about making sure the right resources are in the right place at the right time.
The ability to monitor claims in real-time transforms reactive processes into proactive strategies, allowing for immediate adjustments to resource allocation and risk management protocols.
The Role of Insurtech in Innovation
Insurtech companies are really pushing the boundaries here. They’re built on technology and are often quicker to adopt new analytical tools and data sources. They’re developing innovative ways to use AI and machine learning for more accurate forecasting. This includes things like dynamic pricing models that adjust based on real-time risk factors and automated claims processing that can identify patterns much faster than manual reviews. The collaboration between traditional insurers and insurtech firms is key to bringing these advancements to the broader industry, helping to create more resilient and responsive insurance operations. The future of claims handling is definitely being shaped by these forward-thinking companies, influencing everything from policy interpretation to how we manage complex liabilities like those in Employment Practices Liability.
| Technology Area | Impact on Claims Analysis |
|---|---|
| Artificial Intelligence | Enhanced pattern recognition, fraud detection, predictive modeling |
| Machine Learning | Dynamic forecasting, risk segmentation, automated decision support |
| Big Data Analytics | Integration of diverse data sources for deeper insights |
| Cloud Computing | Scalable infrastructure for real-time data processing |
Looking Ahead
So, we’ve talked about how insurance claims change with the seasons. It’s not just about predicting a few bumps here and there; it’s about really understanding the patterns. This kind of seasonal modeling helps companies get a better handle on their finances and make sure they’re ready for whatever comes their way. As technology keeps changing and new risks pop up, like those related to climate or new ways of buying insurance, being able to predict these seasonal claim trends will only become more important. It’s all about staying prepared and keeping things running smoothly for everyone involved.
Frequently Asked Questions
What is seasonal claims trend modeling?
It’s like looking at weather patterns, but for insurance claims. We study how claims change throughout the year – for instance, more car accidents in winter or more storm damage in summer. By understanding these yearly ups and downs, we can make better guesses about how many claims might happen in the future.
Why is data important for understanding claim trends?
Data is the key! It’s like the clues in a detective story. We look at past claim information – when they happened, what they were for, and how much they cost. This helps us spot patterns and understand what makes claims go up or down.
How do you find patterns in claims data?
We use special tools and math to look for repeating cycles. Think of it like finding a rhythm in music. We might see that claims for certain types of damage always increase around holidays or during specific seasons. Spotting these rhythms helps us predict what might happen next.
Can you really predict future claims?
We can make educated guesses, or forecasts. By studying past trends and understanding what causes them, we can create models that help us estimate future claim numbers. It’s not a crystal ball, but it’s a very useful way to plan ahead.
What else besides time of year affects claims?
Lots of things! Big weather events like hurricanes or floods can cause a sudden jump in claims. Also, how the economy is doing can change how people behave, which might affect claims. Even new rules or laws can have an impact.
How does technology help with this?
Technology is a game-changer! Computers can process huge amounts of data much faster than people. We use smart software, like artificial intelligence, to find patterns we might miss and make our predictions more accurate. It helps us manage claims better too.
What are the hardest parts of predicting claim trends?
Sometimes the data we have isn’t perfect or is hard to get. Also, making the prediction tools too complicated can make them hard to understand. And, of course, unexpected events, like a sudden pandemic, can throw off even the best predictions.
What’s next for predicting claim trends?
We’re always learning! We’ll likely use even more types of information, like social media or real-time weather updates. The goal is to get better and better at predicting trends so insurance companies can be prepared and serve people well.